
Node graph for metrics and traces#
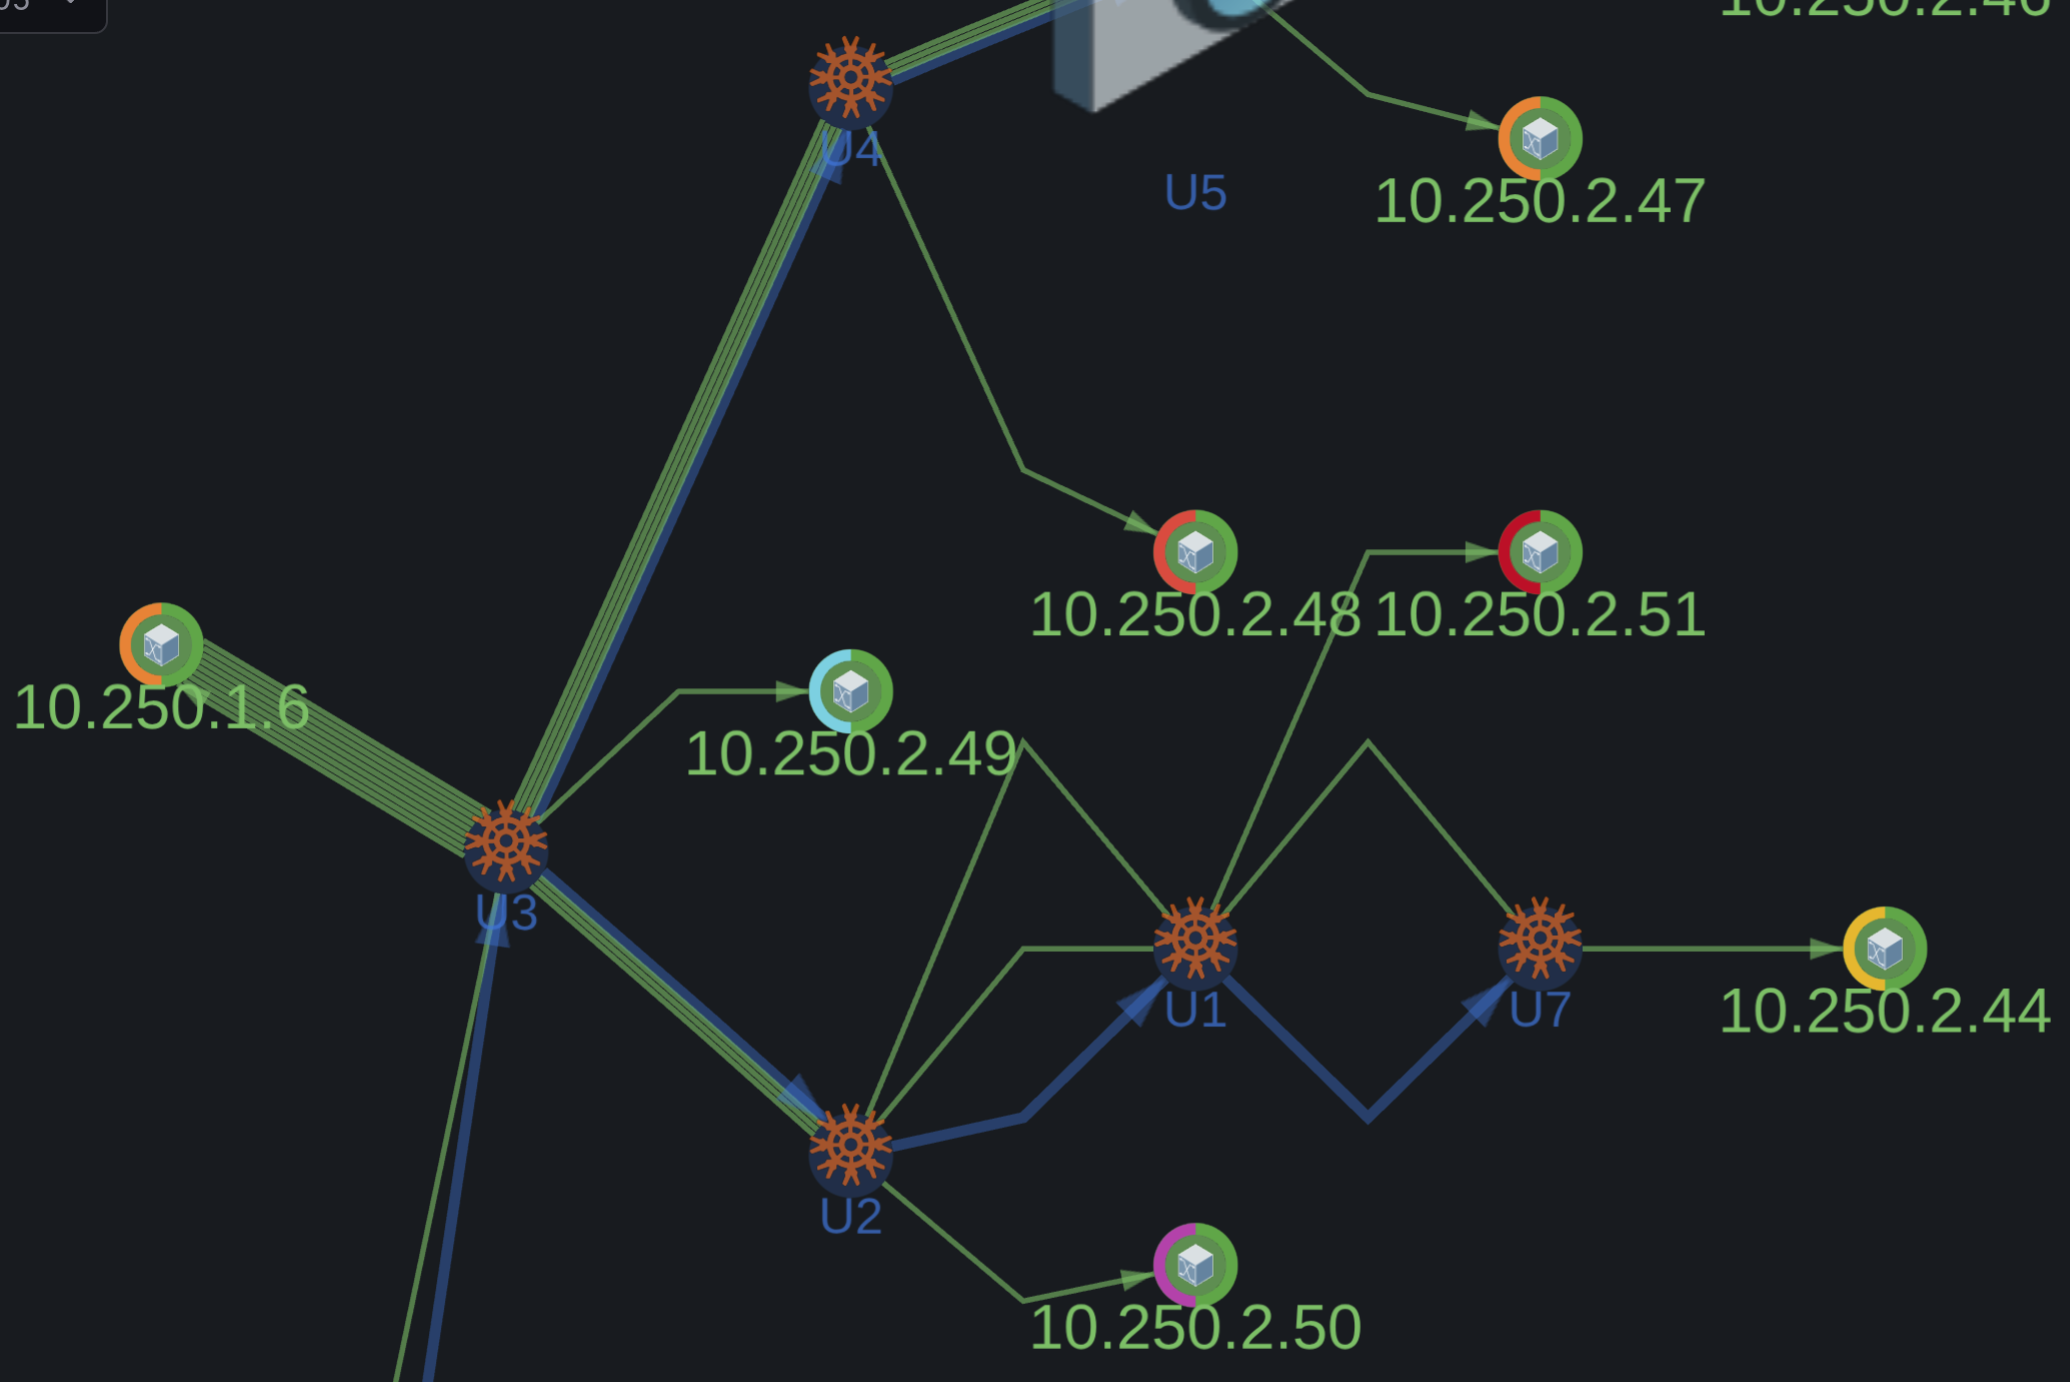
- Layered auto-layout and Geomap view
- Multi-step and parallel-edge routing
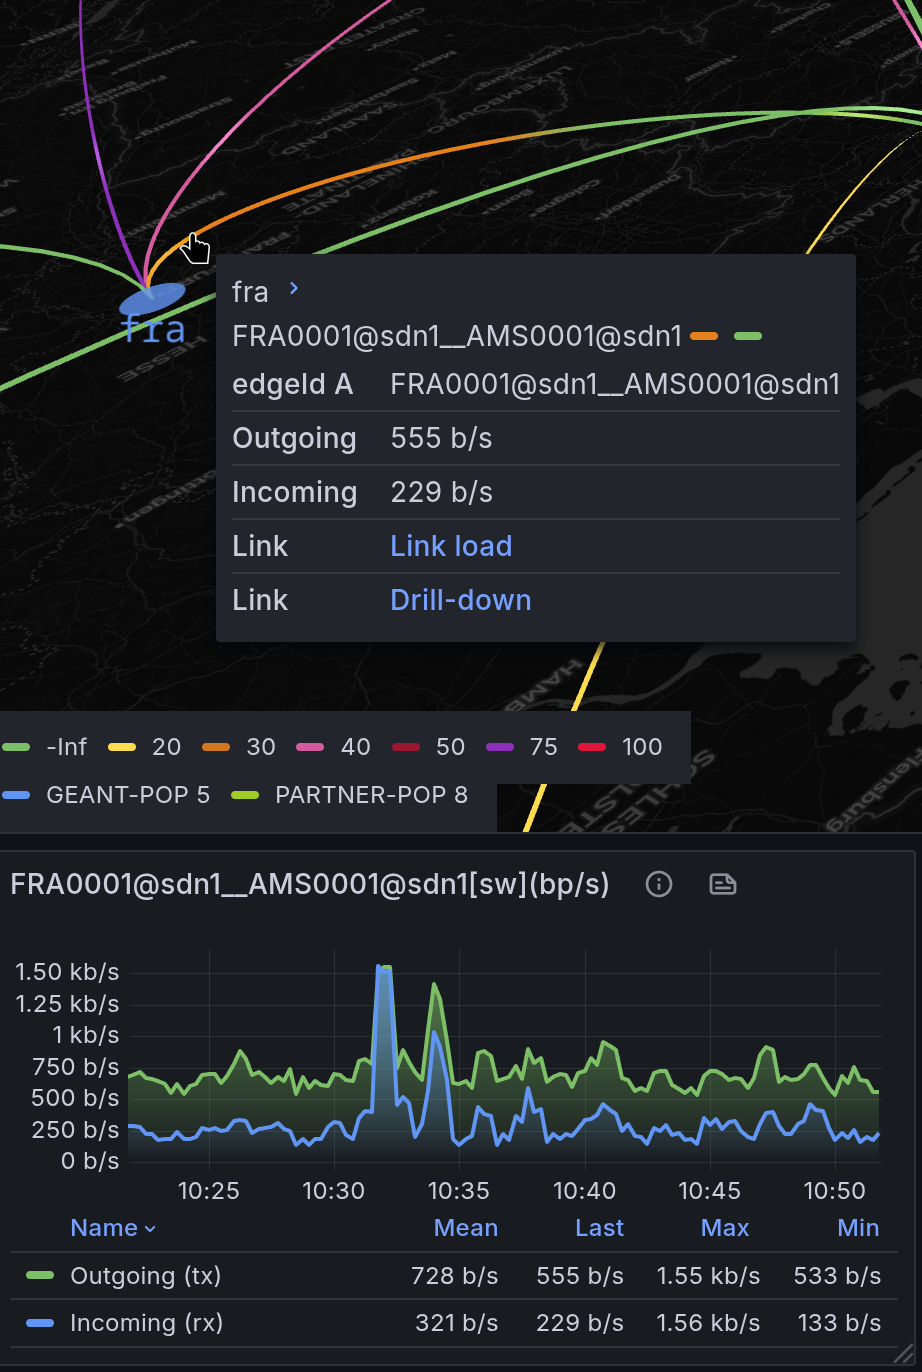
- Arc segments on nodes for visualizing multiple metrics
- TX/RX interface load visualization with dual-metric arcs
- Ad hoc filtering by layer and node group through the legend
- WebGL-accelerated rendering for large datasets
- Dynamic drill-down links to external panels
- Distributed tracing paths with per-span properties
- Namespace-based subgraphs
🕹️ Live Demo#
Playground with open configuration
📸 Screenshots#
📘 Data Format#
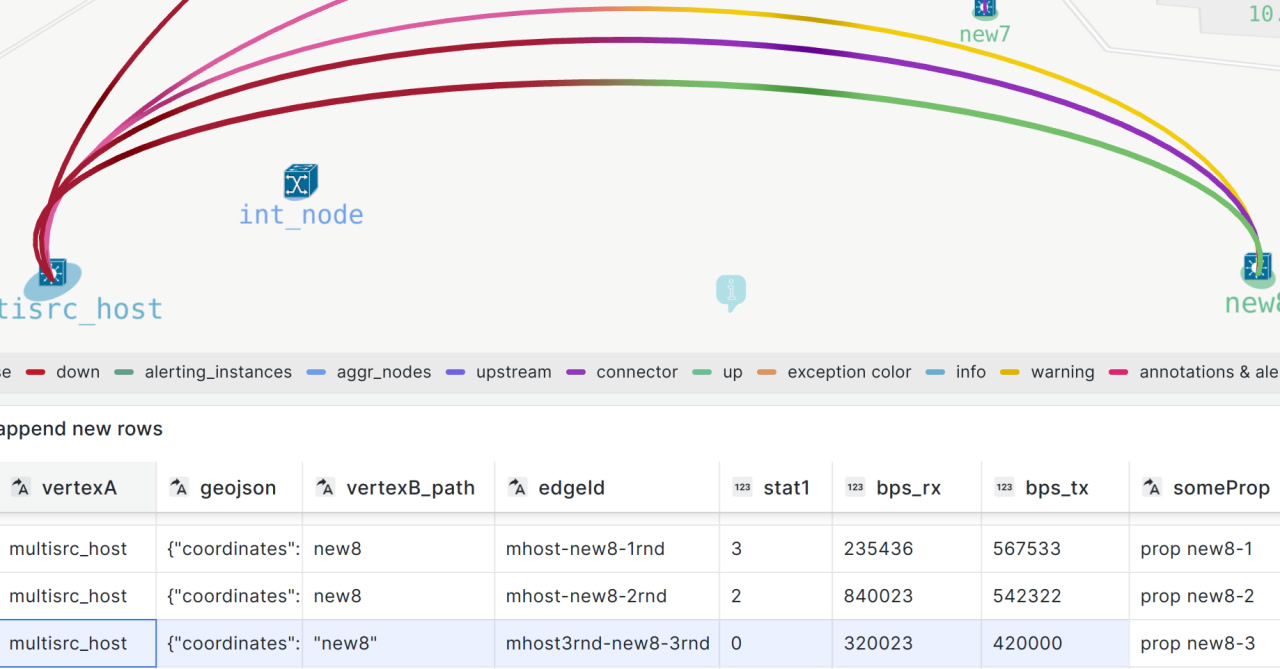 *Unified dataframe model for nodes and links. Field names are examples only; Mapgl does not require fixed field names.
See Panel configuration for setup details and dataframe usage.
🛠️ Data Source#
Use Grafana’s built-in transformations to prepare and merge data from:
- Postgres
- Prometheus
- Zabbix
- Any other datasource
Netbox + Prometheus with drill-down Netbox to Mapgl automation service Zabbix events on geomap
Before you start
One-click plugin installation still requires preparing a unified dataframe from your own datasource mix, which no tutorial can cover completely.
Mapgl requires only the minimum dataframe structure needed to keep your topology flexible, customizable, and portable across data sources.
It is openly distributed and funded by paid support services, helping you avoid vendor lock-in.See the Playground for a live demo, and get professional support to speed up dashboard setup and make the most of Mapgl's unique mental model.
🎛️ Grafana Field Config#
Thresholds– value ranges with associated colors to visually indicate statusMapping– rename displayed valuesUnits– measurement unit conversionOverrides– custom settings for specific metricsDataLinks– links to external dashboards or graphs
Node Group style rules extend control over node color, icon, size, and line width.
🧩 Support#
Onboarding and Extended capabilities