
Network Topology: Node Graph & Geomap#
Abstract node graph with optional geo basemap.
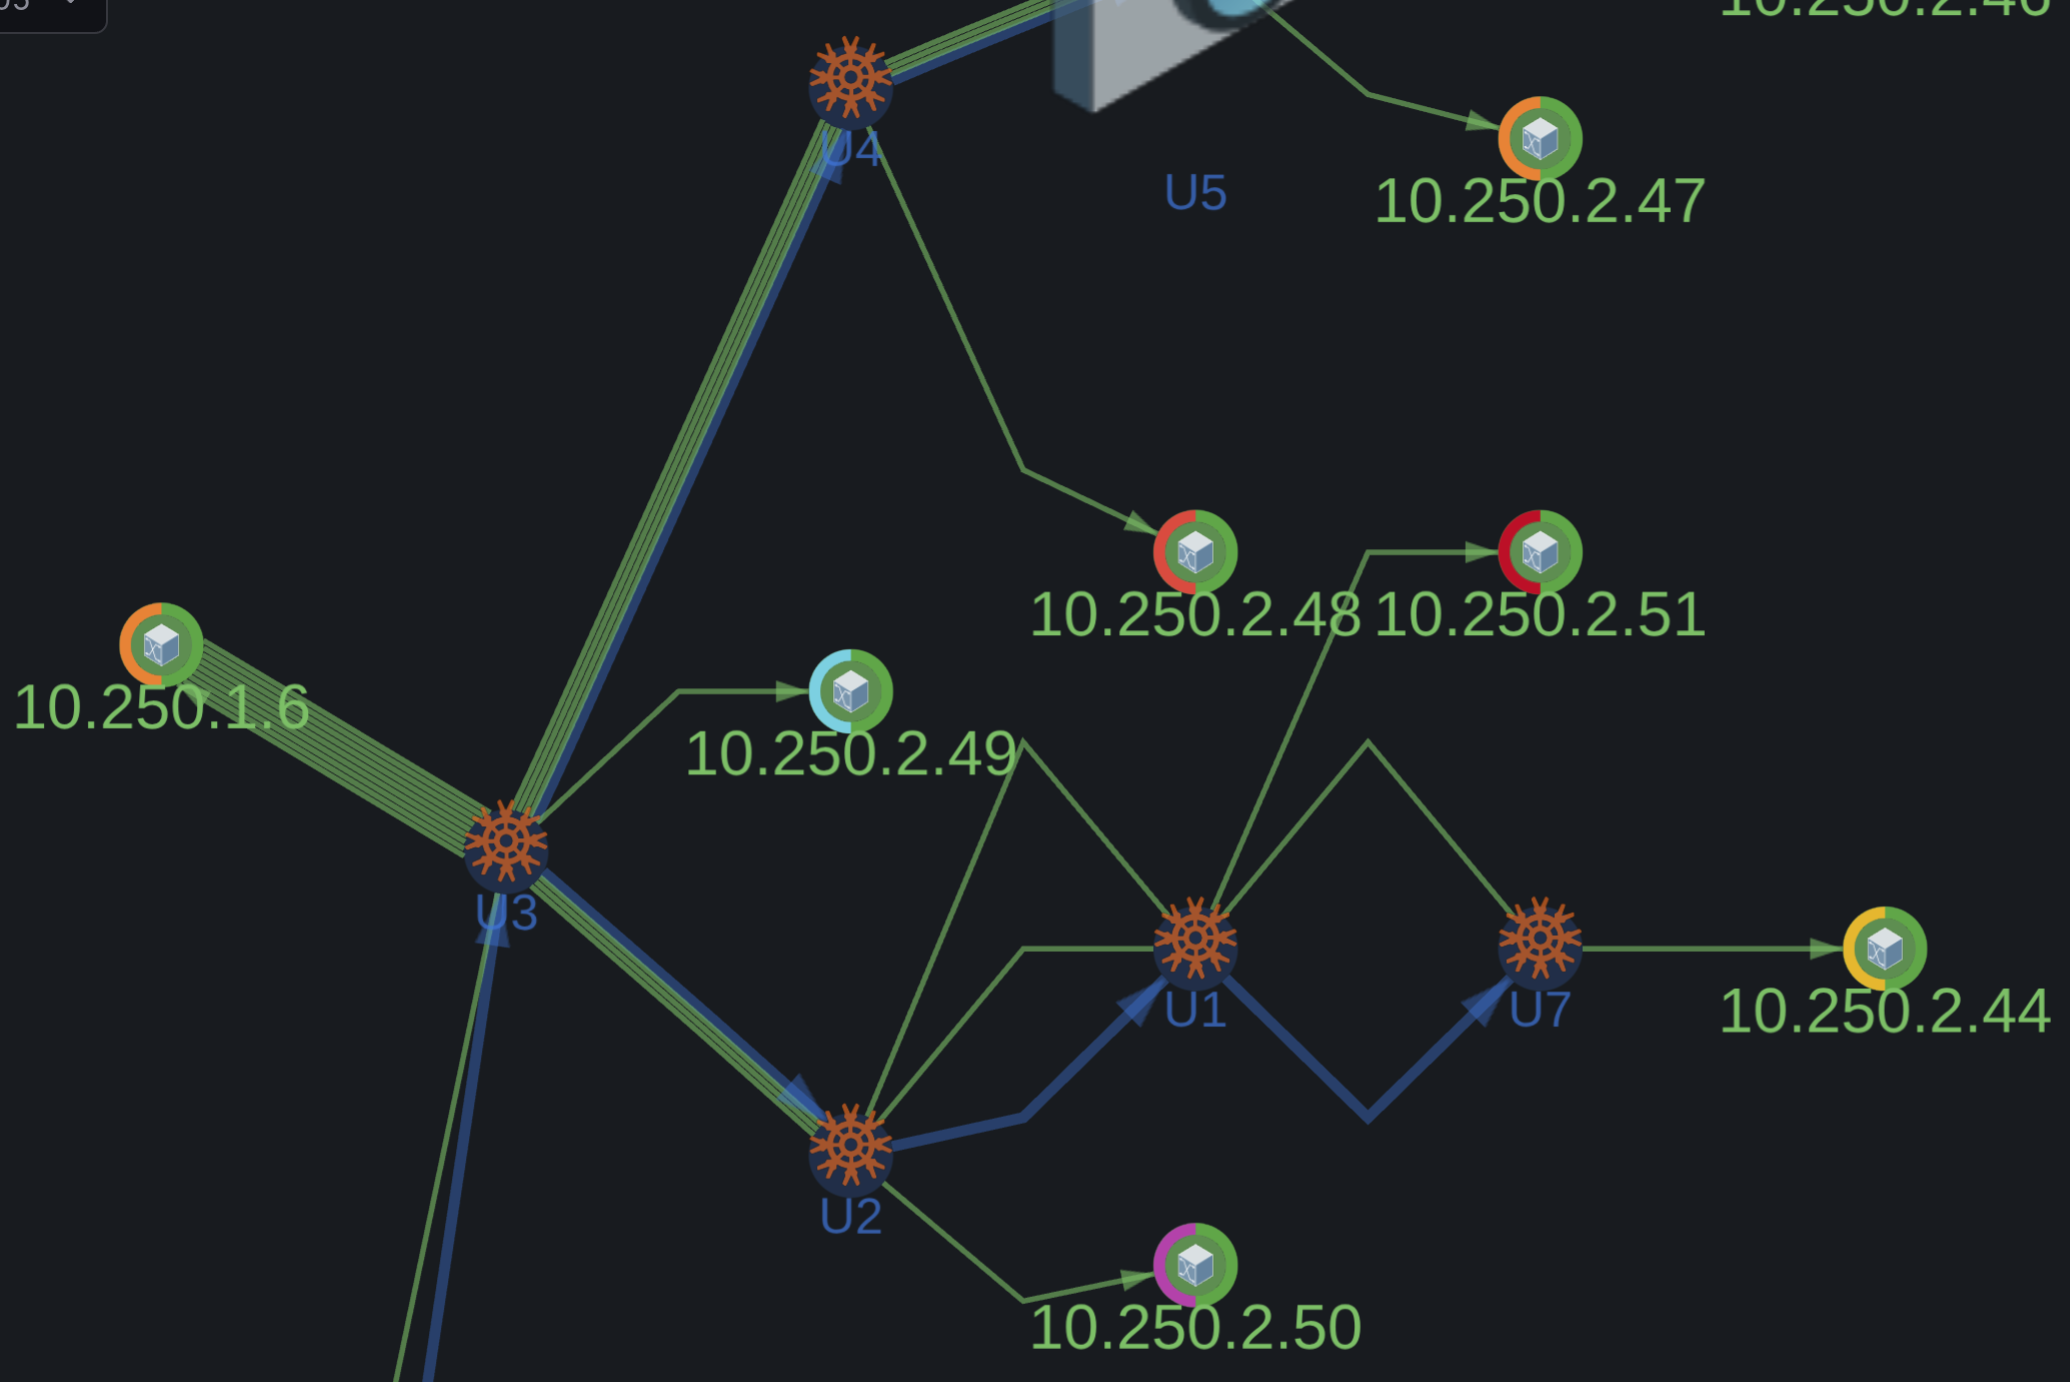
- Layered auto-layout with namespace subgraphs
- Multi-hop connection paths
- Parallel and nested links with offset rendering or min/max aggregation
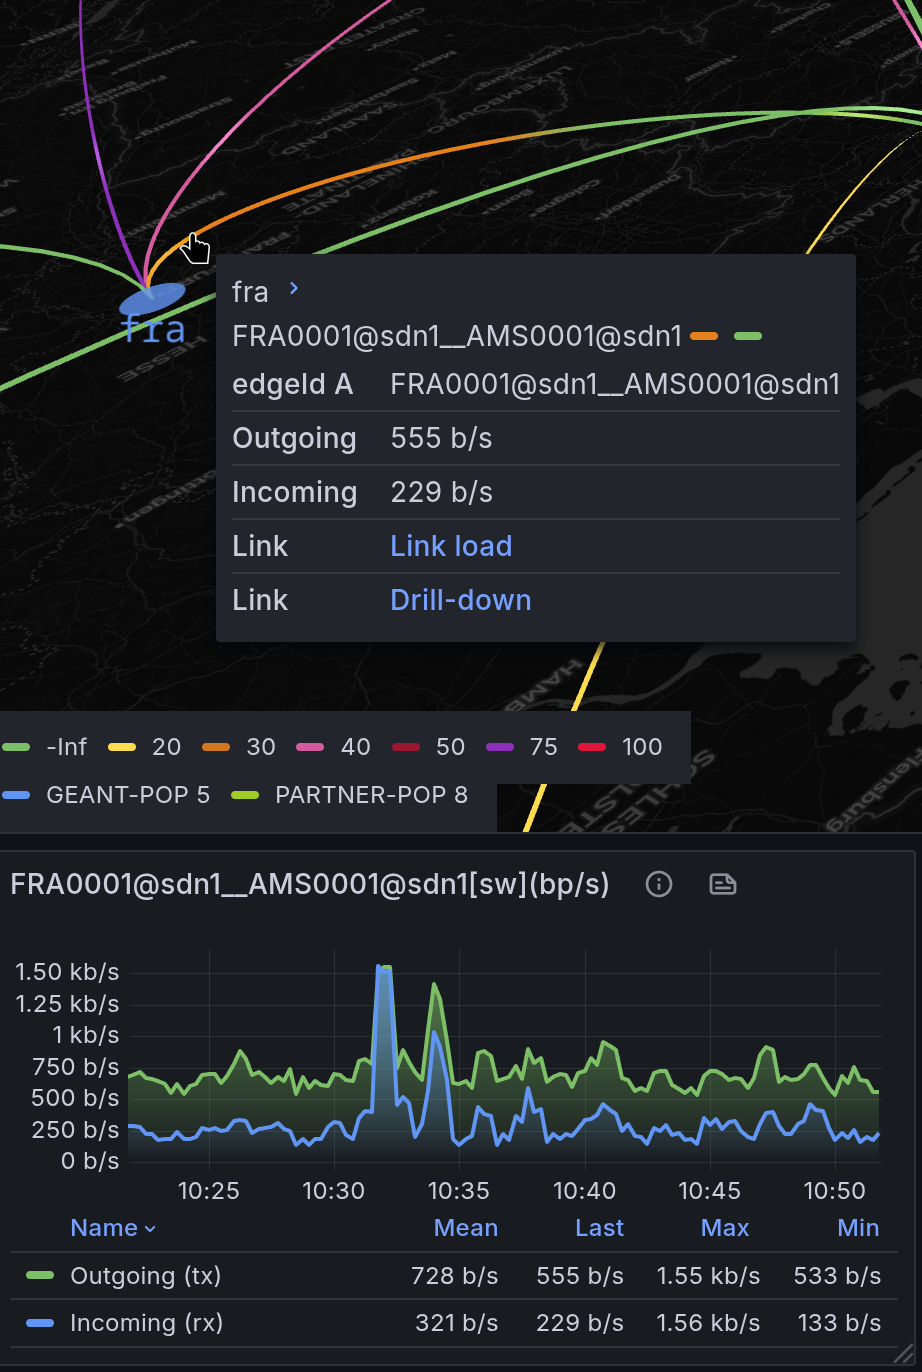
- Network interface TX/RX load visualization using bi-metric arcs
- Dynamic drill-down data links to external panels
- Node group statistics in cluster icon
🕹️ Live Demo#
Playground with open configuration
📘 Data Format#
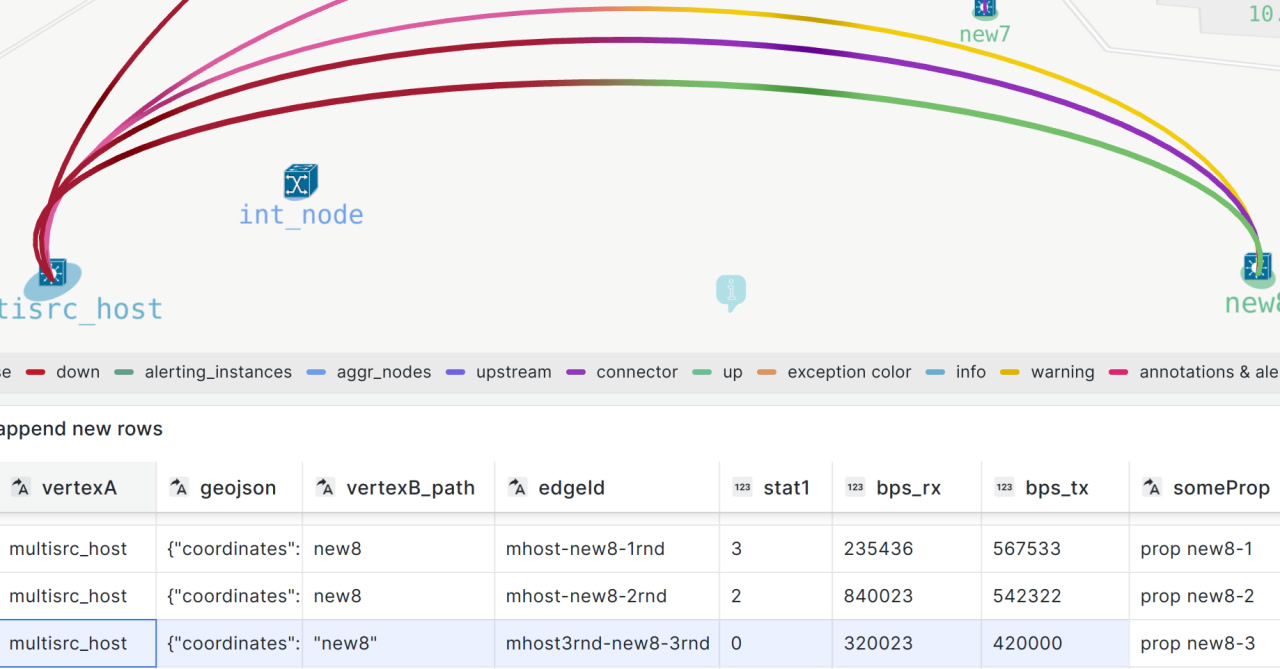 *Unified dataframe model for nodes and links. Field names are examples only; Mapgl does not require fixed field names.
See Panel configuration for setup details and dataframe usage.
🛠️ Data Source#
Use Grafana’s built-in transformations to prepare and merge data from:
- Postgres
- Prometheus
- Zabbix
- Any other datasource
Netbox+Prometheus with drill-down datalinks Zabbix events on geomap
📸 Screenshots#
🎛️ Grafana Field Config#
Thresholds– value ranges with associated colors to visually indicate statusMapping– rename displayed valuesUnits– measurement unit conversionOverrides– custom settings for specific metricsDataLinks– links to external dashboards or graphs
Node Group style rules extend control over node color, icon, size, and line width.